Posts Tagged ‘stock’

Daily Analysis 20230222

Written by itho suryoputro. Posted in Daily Analysis

February 22nd, 2023

Good morning,

Dow closes nearly 700 points lower in broad selloff, as all indexes cap their worst day of 2023

U.S. stocks dropped Tuesday as higher rates continue to pressure market sentiment, and the latest batch of retail earnings raised concern about the state of the consumer.

Dow…..33130 -697.1 -2.06%
Nasdaq11492 -294.97-2.50%
S&P 500..3997 -81.8 -2.00%

FTSE…….7978 -36.6 -0.46%
Dax……..15398 -79.9 -0.52%
CAC……..7309 -26.96 -0.37%

Nikkei…..27473 -58.8 -0.21%
HSI………20529 -357.5 -1.71%
Shanghai.3307 +16.2 +0.49%

IDX…..6873.40 -21.31 -0.31%
LQ45….950.51 -4.35 -0.46%
IDX30…493.89 -2.66 -0.54%

IDXEnergy…2052.01 -18.00 -0.87%
IDX BscMat 1256.60 +8.62 +0.69%
IDX Indstrl…1140.26 -5.50 -0.48%
IDXNONCYC..764.13 -0.43 -0.06%
IDX Hlthcare1608.56 -2.78 -0.17%
IDXCYCLIC…848.36 +2.71 +0.32%
IDX Techno.5511.82 -17.86 -0.32%
IDX Transp1878.91 +42.4 +2.31%
IDX Infrast….873.35 -1.82 -0.21%
IDX Finance1422.16 -9.97 -0.70%
IDX Banking1148.46 -13.39 -1.15%
IDX Property….687 -3.20 -0.46%

Indo10Yr.6.7923 +0.0186 +0.27%
ICBI..350.5887 -0.2732 -0.08%
US10Yr3.9550 +0.1270 +3.32%‼️
VIX…..22.82 +1.59 +7.49%‼️

USDIndx104.1830+0.3150 +0.30%‼️
Como Indx.268.48 +0.91 +0.34%
(Core Commodity CRB)
BCOMIN….168.42 +5.29 +3.24%‼️

IndoCDS..105.25 – -%
(5-yr INOCD5) (07/11)

IDR…..15190.00 +31.00 +0.20%
Jisdor.15179.00 +11.00 +0.07%

Euro……1.0644 -0.0042 -0.39%

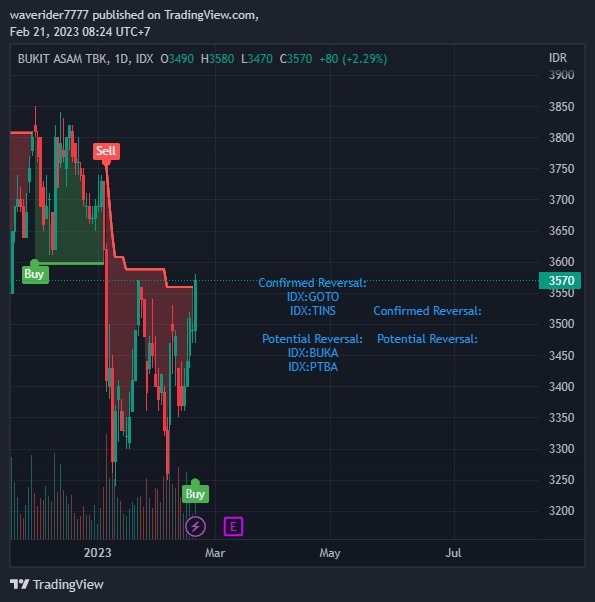
TLKM….25.09 +0.23 +0.93%
(3808)
EIDO……23.07 -0.11 -0.47%
EEM……39.18 -0.50 -1.26%

Oil…….76.16 -0.97 -1.26%
Gold 1843.70 -6.60 -0.36%
Timah 26700 +844.00 +3.26%‼️
(Closed 02/20)
Nickel.26889.50 -196.50.00 -0.73%
(Closed 02/21)
Silver…….22.00 +0.03 +0.14%
Copper..420.00 +4.14 +1.00%

Nturl Gas.2.184 -0.126 -5.45%‼️

Ammonia 4290.00 -33.30 -0.77%
China
(Domestic Price)(02/20)

Coal price.209.00 +3.35 +1.63%
(Feb/Newcastle)
Coal price187.00 +7.50 +4.18%
(Mar/Newcastle)
Coal price188.00 +12.00 +6.82%‼️
(Apr/Newcastle)
Coal price196.00 +16.50 +9.19%‼️
(Mei/Newcastle)

Coal price.137.00 +0.50 +0.37%
(Feb/Rotterdam)
Coal price 136.00 +3.00 +2.26%
(Mar/ Rotterdam)
Coal price134.50 -1.50 -1.10%
(Apr/Rotterdam)
Coal price133.00 +1.70 +1.29%
(May/Rotterdam)

CPO(May)….4139 -15 -0.36%
(Source: bursamalaysia.com)

Corn………..680.25 +2.75 +0.41%
SoybeanOil..62.80 +1.06. +1.70%
Wheat…….762.75 -13.50 -1.74%

Wood pulp…5990.00 -40 -0.66%
(Closed 02/20)

©️Phintraco Sekuritas
Broker Code: AT
Desy Erawati/ DE
Source: Bloomberg, Investing, IBPA, CNBC, Bursa Malaysia
Copyright: Phintraco Sekuritas

Wah, US drop, europe merah juga, asia kecuali shanghai merah juga

Oil Gas Drop, coal ijo, gantian terus ini… Bagus deh buat saham2 coal. Metal2 kebanyakan naik, gold merah tipis, nikel merah, CPO merah lagi tapi semoga AALI LSIP tetep jalan

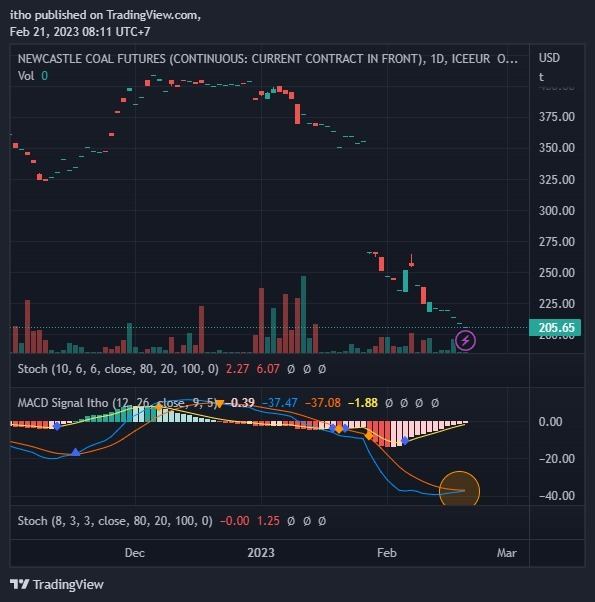
Coal NCF akhirnya MACD buy signal, semoga rebound nya cukup tinggi, sampe tutup gap aja deh cukup buang ngangkat saham coal 20-25% an harusnya

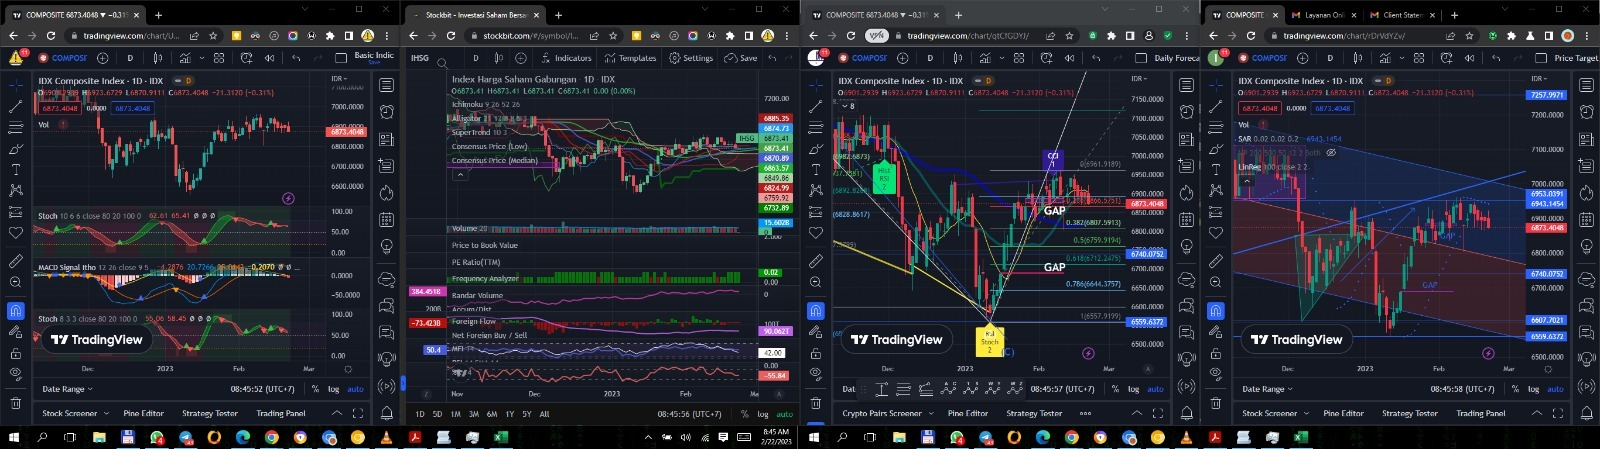
IHSG – rada2 tweezer bottom, semoga mantul, tapi candle terakhir yang close nya dibawah bikin khawatir juga. Yang jelas hati2 belanja sebelum MACD dan stoch nya ngebalik lagi ke atas, stoch sw macd down, mfi down, BD ga jagain hari terakhir, FNS tipis udah 3-4 hari, masih uptrend majornya, wave 3, semoga ga lama lagi mulai rally, perlu didorong sama big banks sih

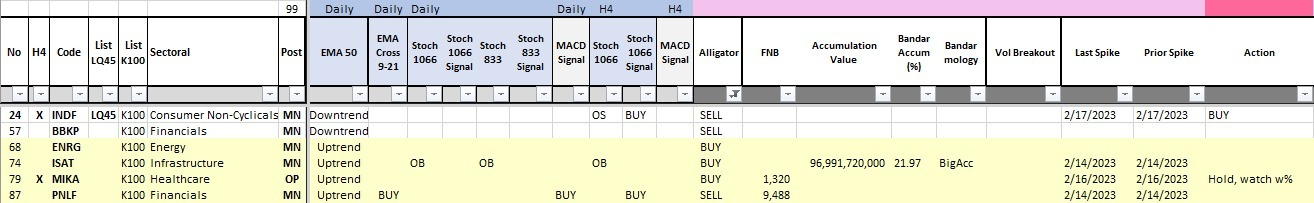
Basic Materials mulai bangun, yang leading masih healthcare, Consumer Non-Cyclicals, Infrastructure

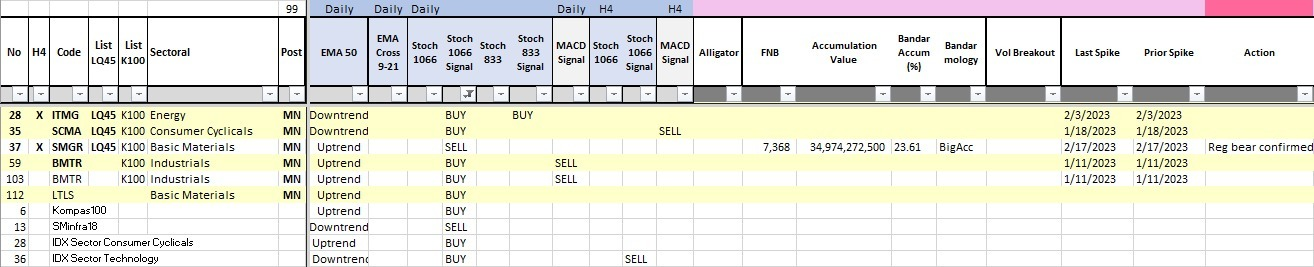
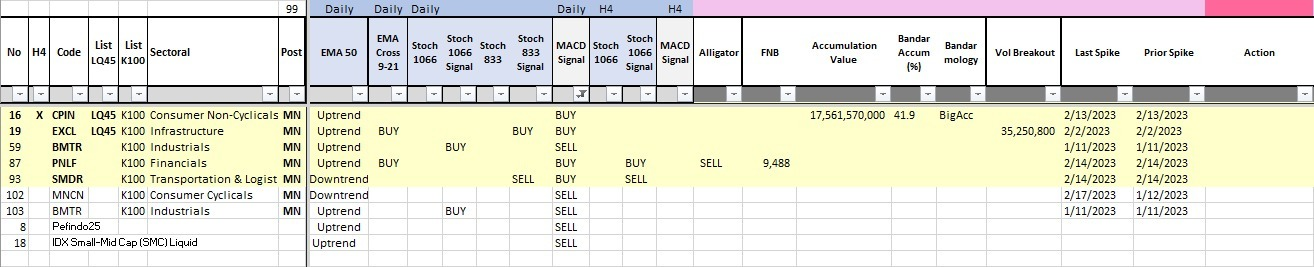
Stochastic Buy Signal: ARTO INCO INCI

MACD Buy Signal: TOWR ABMM SGRO

Alligator Buy Signal: AGRO WIFI

Daily Analysis 20230221

Written by itho suryoputro. Posted in Daily Analysis

February 21st, 2023

Good morning,

U.S markets on holiday due to President Day

Dow…….33827 closed +0%
Nasdaq.11787 closed +0%
S&P 500..4079 closed +0%

FTSE…….8014 +9.96 +0.12%
Dax……..15478 -4.5 -0.03%
CAC……..7336 -12.1 -0.16%

Nikkei…..27532 +18.8 +0.07%
HSI………20887 +167.2 +0.81%
Shanghai.3290 +66.3 +2.06%

IDX…..6894.72 -1.00 -0.01%
LQ45….954.85 +0.47 +0.05%
IDX30…496.56 +0.25 +0.05%

IDXEnergy…2070.01 -12.24 -0.59%
IDX BscMat 1247.98 -2.70 -0.22%
IDX Indstrl…1145.75 -9.43 -0.82%
IDXNONCYC..764.55 +5.28 +0.70%
IDX Hlthcare1611.34 -4.39 -0.27%
IDXCYCLIC…845.64 +1.24 +0.15%
IDX Techno.5529.68 -83.77 -1.49%
IDX Transp1836.55 -5.13 -0.28%
IDX Infrast….875.17 +9.96 +1.15 %
IDX Finance1432.13 +4.49 +0.31%
IDX Banking1161.85 -0.33 -0.03%
IDX Property….690 +0.20 +.0.03%

Indo10Yr.6.7641 +0.0096 +0.14%
ICBI..350.8619 -0.0291 -0.01%
US10Yr.3.8280 closed +0%
VIX……….21.23 +1.23 +6.04%‼️

USDIndx103.8680 -0.1820 -0.17%
Como Indx.267.57closed +0%
(Core Commodity CRB)
BCOMIN….163.14 closed +0%

IndoCDS..105.25 – -%
(5-yr INOCD5) (07/11)

IDR…..15159.00 -51.00 -0.34%
Jisdor.15168.00 -22.00 -0.14%

Euro……1.0686 unch +0%

TLKM….24.86 closed +0%
(3778)
EIDO……23.18 closed +0%
EEM……39.68 closed +0%

Oil…….77.13 +0.79 +1.03%
Gold 1850.30 +0.10 +0.01%
Timah 25856 closed +0%
(Closed 02/17)
Nickel.27086.00 +439.00 +1.65%
(Closed 02/20)
Silver…….21.97 +0.11 +0.50%
Copper..415.86 +5.35 +1.30%

Nturl Gas.2.311 +0.0011 +0.48%

Ammonia 4323.33 – -0%
China
(Domestic Price)(02/16)

Coal price.205.65 -3.70 -1.77%_
(Feb/Newcastle)
Coal price179.50 -3.50 -1.91%
(Mar/Newcastle)
Coal price176.00 -4.65 -2.57%
(Apr/Newcastle)
Coal price179.50 -2.90 -1.59%
(Mei/Newcastle)

Coal price.136.50 unch +0%
(Feb/Rotterdam)
Coal price 133.00-3.20 -2.35%
(Mar/ Rotterdam)
Coal price136.00 +1.05 +0.78%
(Apr/Rotterdam)
Coal price131.30 -3.10 -2.23%
(May/Rotterdam)

CPO(May)….4124 +27 +0.65%
(Source: bursamalaysia.com)

Corn………..677.50 closed +0%
SoybeanOil..61.75 closed +0%
Wheat…….776.25 closed +0%

Wood pulp…6030.00 unch +0%
(Closed 02/20)

©️Phintraco Sekuritas
Broker Code: AT
Desy Era9wati/ DE
Source: Bloomberg, Investing, IBPA, CNBC, Bursa Malaysia
Copyright: Phintraco Sekuritas

US tutup, asia rata2 ijo, europe tipis2, IDX hampir doji, bisa dianggap doji lah, semoga pertanda reversal

oil gas ijo, coal merah, metal2 ijo, CPO lanjut ijo. Bagus buat tambang2 mineral yang kemaren pada dibanting harganya, pas juga kemaren index doji, buat rebound hari ini.

NCF – masih turun, tapi kalo dari MACD keliatannya sebentar lagi udahan downtrend nya, semoga pas dan bawa saham2 coal ke atas

IHSG – stoch down, macd down, MFI down,w% flat, BD acc, FF masih NFS tapi tipis, dari candle keliatan udah ga mau dibawa turun, closing selalu balik ke level 6895-an. Kayanya tinggal nunggu release resmi LK big banks terus rally breakout resistance

Healthcare, Infrastructure, Energy. Consumer Non-Cyclicals bangun lagi

Stoch Buy Signal: ITMG SCMA BMTR LTLS

MACD Buy Signal: CPIN EXCL PNLF SMDR

Alligator Buy Signal: ENRG ISAT MIKA

Supertrend Buy Signal: PTBA

Daily Analysis 20230220

Written by itho suryoputro. Posted in Daily Analysis

February 20th, 2023

Good morning,

Dow closes more than 100 points higher on Friday, but notches third straight week of losses on rate fears: Live updates

U.S. stocks were mixed on Friday as stubbornly high inflation and a rebound in rates continued to weigh on investor sentiment.

Dow…….33827 +129.8 +0.39%
Nasdaq.11787 -68.6 -0.58%
S&P 500..4079 -11.3 -0.28%

FTSE…….8004 -8.1 -0.10%
Dax……..15482 -51.6 -0.33%
CAC……..7348 -18.4 -0.25%

Nikkei…..27513 -183.3 -0.66%
HSI………20720 -267.9 -1.28%
Shanghai..3224 -25.01 -0.77%

IDX…..6895.71 +0.05 +0.05%
LQ45….954.38 +0.89 +0.09%
IDX30…496.30 +0.62 +0.12%

IDXEnergy…2082.24 -15.90 -0.76%
IDX BscMat 1250.68 -9.82 -0.78%
IDX Indstrl…1155.18 -2.51 -0.22%
IDXNONCYC..759.27 +3.86 +0.51%
IDX Hlthcare1615.73 +10.34+0.64%
IDXCYCLIC…844.41 -5.31 -0.63%
IDX Techno5613.44 +27.60 +0.49%
IDX Transp1841.68 -5.26 -0.28%
IDX Infrast….865.21 -1.82 -0.21 %
IDX Finance1427.65 +4.48 +0.32%
IDX Banking1162.24 +5.43 +0.47%
IDX Property….697 – -%

Indo10Yr.6.7641 -0.0056 -0.08%
ICBI..350.7567 +0.1073 +0.03%
US10Yr.3.8280 -0.0150 -0.39%
VIX……20.02 -0.15 -0.74%

USDIndx104.0500+0.2289+0.21%‼️
Como Indx.267.57 -2.68 -0.99%
(Core Commodity CRB)
BCOMIN…..163.14 -0.34 -0.21%

IndoCDS..105.25 – -%
(5-yr INOCD5) (07/11)

IDR…..15210.00 +51.00 +0.34%‼️
Jisdor.15199.00 +23.00 +0.15%‼️

Euro……1.0686 -0.0004 -0.04%

TLKM….24.86 -0.01 -0.04%
(3778)
EIDO……23.18 -0.11 -0.47%
EEM……39.68 -0.44 -1.10%

Oil…….76.34 -2.15 -2.74%
Gold 1850.20 -1.60 -0.09%
Timah 25856 -1148.00 -4.25%‼️
(Closed 02/17)
Nickel.26647.00 -967.50 -3.63%‼️
(Closed 02/17)
Silver…….21.86 -0.01 -0.06%
Copper..410.50 -1.65 -0.40%

Nturl Gas.2.300 -0.093 -3.88%‼️

Ammonia 4323.33 -83.34 -1.89%
China
(Domestic Price)(02/16)

Coal price.209.35 -4.65 -2.17%
(Feb/Newcastle)
Coal price183.00 -3.30 -1.77%
(Mar/Newcastle)
Coal price180.65 -3.30 -1.79%
(Apr/Newcastle)
Coal price182.40 -3.05 -1.64%
(Mei/Newcastle)

Coal price.136.50 -0.50 -0.36%
(Feb/Rotterdam)
Coal price 136.20-2.80 -2.01%
(Mar/ Rotterdam)
Coal price134.95 -2.05 -1.50%
(Apr/Rotterdam)
Coal price134.30 -3.10 -2.26%
(May/Rotterdam)

CPO(May)….4136 +66 +1.62%
(Source: bursamalaysia.com)

Corn………..677.50 +2.50 +0.37%
SoybeanOil..61.75 -0.40 -0.64%
Wheat…….776.25 unch +0%

Wood pulp…6030.00 unch +0%
(Closed 02/19)

©️Phintraco Sekuritas
Broker Code: AT
Desy Era9wati/ DE
Source: Bloomberg, Investing, IBPA, CNBC, Bursa Malaysia
Copyright: Phintraco Sekuritas

Semua merah kecuali Dollar Index dan DJI, Kospi dan IDX ijo tipis, almost doji. Not good, tapi asal major uptrend malah jadi waktunya belanja

Semua commodity juga merah kecuali CPO, pas buat AALI sama LSIP untuk finally jalan

IHSG – belum berhasil breakout resistance, masih NFS, BD flat, MACD sell, Stoch sw, MFI down, ST up alligator up, w% sw, masih sideways dulu kayanya, dengan big banks LK bagus optimis major tetep uptrend, tapi hati2 sell-off pemain teknikal bisa banting karena pada exit liat MACD sell

Healthcare, Infrastructure (versi telco and tower provider, bukan BUMN karya), Energy (versi coal)

Stochastic Buy Signal: GOTO INDY TOWR AALI AGRO ASSA DSNG JSMR PNLF AFMG

JSMR very big accumulation

MACD Buy Signal: AFMG

Alligator Buy Signal: BRIS

Supertrend Buy Signal: GOTO

What It Is and the Formula

Written by admin. Posted in Technical Analysis

[ad_1]

What Is a Simple Moving Average (SMA)?

A simple moving average (SMA) calculates the average of a selected range of prices, usually closing prices, by the number of periods in that range.

Key Takeaways

  • Simple moving averages calculate the average of a range of prices by the number of periods within that range.
  • A simple moving average is a technical indicator that can aid in determining if an asset price will continue or if it will reverse a bull or bear trend.
  • A simple moving average can be enhanced as an exponential moving average (EMA) that is more heavily weighted on recent price action.

Understanding Simple Moving Average (SMA)

A simple moving average (SMA) is an arithmetic moving average calculated by adding recent prices and then dividing that figure by the number of time periods in the calculation average. For example, one could add the closing price of a security for a number of time periods and then divide this total by that same number of periods. Short-term averages respond quickly to changes in the price of the underlying security, while long-term averages are slower to react. There are other types of moving averages, including the exponential moving average (EMA) and the weighted moving average (WMA).

Investopedia / Sabrina Jiang


The formula for SMA is:


SMA = A 1 + A 2 + . . . + A n n where: A n = the price of an asset at period  n n = the number of total periods \begin{aligned} &\text{SMA}=\dfrac{A_1 + A_2 + … + A_n}{n} \\ &\textbf{where:}\\ &A_n=\text{the price of an asset at period } n\\ &n=\text{the number of total periods}\\ \end{aligned}
SMA=nA1+A2+...+Anwhere:An=the price of an asset at period nn=the number of total periods

For example, this is how you would calculate the simple moving average of a security with the following closing prices over a 15-day period.

Week One (5 days): 20, 22, 24, 25, 23

Week Two (5 days): 26, 28, 26, 29, 27

Week Three (5 days): 28, 30, 27, 29, 28

A 10-day moving average would average out the closing prices for the first 10 days as the first data point. The next data point would drop the earliest price, add the price on day 11, then take the average, and so on. Likewise, a 50-day moving average would accumulate enough data to average 50 consecutive days of data on a rolling basis.

A simple moving average is customizable because it can be calculated for different numbers of time periods. This is done by adding the closing price of the security for a number of time periods and then dividing this total by the number of time periods, which gives the average price of the security over the time period.

A simple moving average smooths out volatility and makes it easier to view the price trend of a security. If the simple moving average points up, this means that the security’s price is increasing. If it is pointing down, it means that the security’s price is decreasing. The longer the time frame for the moving average, the smoother the simple moving average. A shorter-term moving average is more volatile, but its reading is closer to the source data.

One of the most popular simple moving averages is the 200-day SMA. However, there is a danger to following the crowd. As The Wall Street Journal explains, since thousands of traders base their strategies around the 200-day SMA, there is a chance that these predictions could become self-fulfilling and limit price growth.

Special Considerations

Analytical Significance

Moving averages are an important analytical tool used to identify current price trends and the potential for a change in an established trend. The simplest use of an SMA in technical analysis is using it to quickly determine if an asset is in an uptrend or downtrend.

Another popular, albeit slightly more complex, analytical use is to compare a pair of simple moving averages with each covering different time frames. If a shorter-term simple moving average is above a longer-term average, an uptrend is expected. On the other hand, if the long-term average is above a shorter-term average then a downtrend might be the expected outcome.

Popular Trading Patterns

Two popular trading patterns that use simple moving averages include the death cross and a golden cross. A death cross occurs when the 50-day SMA crosses below the 200-day SMA. This is considered a bearish signal, indicating that further losses are in store. The golden cross occurs when a short-term SMA breaks above a long-term SMA. Reinforced by high trading volumes, this can signal further gains are in store.

Simple Moving Average vs. Exponential Moving Average

The major difference between an exponential moving average (EMA) and a simple moving average is the sensitivity each one shows to changes in the data used in its calculation. More specifically, the EMA gives a higher weighting to recent prices, while the SMA assigns an equal weighting to all values.

The two averages are similar because they are interpreted in the same manner and are both commonly used by technical traders to smooth out price fluctuations. Since EMAs place a higher weighting on recent data than on older data, they are more reactive to the latest price changes than SMAs are, which makes the results from EMAs more timely and explains why the EMA is the preferred average among many traders.

Simple Vs. Exponential Moving Averages

Limitations of Simple Moving Average

It is unclear whether or not more emphasis should be placed on the most recent days in the time period or on more distant data. Many traders believe that new data will better reflect the current trend the security is moving with. At the same time, other traders feel that privileging certain dates over others will bias the trend. Therefore, the SMA may rely too heavily on outdated data since it treats the 10th or 200th day’s impact the same as the first or second day’s.

Similarly, the SMA relies wholly on historical data. Many people (including economists) believe that markets are efficient—that is, that current market prices already reflect all available information. If markets are indeed efficient, using historical data should tell us nothing about the future direction of asset prices.

How Are Simple Moving Averages Used in Technical Analysis?

Traders use simple moving averages (SMAs) to chart the long-term trajectory of a stock or other security, while ignoring the noise of day-to-day price movements. This allows traders to compare medium- and long-term trends over a larger time horizon. For example, if the 200-day SMA of a security falls below its 50-day SMA, this is usually interpreted as a bearish death cross pattern and a signal of further declines. The opposite pattern, the golden cross, indicates potential for a market rally.

How Do You Calculate a Simple Moving Average?

To calculate a simple moving average, the number of prices within a time period is divided by the number of total periods. For instance, consider shares of Tesla closed at $10, $11, $12, $11, $14 over a five day period. The simple moving average of Tesla’s shares would equal $10 + $11 + $12 + $11 + $14 divided by 5, equaling $11.6.

What Is the Difference Between a Simple Moving Average and an Exponential Moving Average?

While a simple moving average gives equal weight to each of the values within a time period, an exponential moving average places greater weight on recent prices. Exponential moving averages are typically seen as a more timely indicator of a price trend, and because of this, many traders prefer using this over a simple moving average. Common short-term exponential moving averages include the 12-day and 26-day. The 50-day and 200-day exponential moving averages are used to indicate long-term trends.

[ad_2]

Source link