Posts Tagged ‘Oscillator’

Daily Analysis 20240104

Written by itho suryoputro. Posted in Daily Analysis

January 04th, 2024
Good morning,
Dow tumbles nearly 300 points Wednesday, Nasdaq closes lower for a 2nd straight day in 2024
The Nasdaq Composite
 fell for a second session Wednesday to start the year, building on its worst daily performance in nearly three months.
Dow……37430   -284.9   -0.76%
Nasdaq14592   -173.7   -1.18%
S&P 500.4705   -38.02   -0.80%
FTSE…..7682  -39.2     -0.51%
Dax……16538 -230.97 -1.38%
CAC……7412  -119.0    -1.58%
Nikkei..33464    closed   +0%
HSI…….16646   -142.1    -0.85%
Shanghai.2967 +4.97     +0.17%
IDX…..7379.09 -44.50    -0.61%
LQ45….973.38 -6.05       -0.38%
IDX30…494.25 -4.17       -0.84%
IDXEnergy..2134.80   -8.16     -0.38%
IDX BscMat.1326.31 -5.83     -0.44%
IDX Indstrl…1103.81 -1.70     -0.15%
IDXNONCYC.718.44 -5.97     -0.82%
IDX Hlthcare1341.16 -12.40  -0.92%
IDXCYCLIC…825.24  +3.63    +0.44%
IDX Techno4418.00  +0.19    +0.02%
IDX Transp 1656.97 +2.01     +0.12%
IDX Infrast  1577.29. +0.98   +0.06%
IDX Finance.1448.02 -4.07.   -0.28%
IDX Banking.1267.99 -1.01    -0.08%
IDX Property.. 709      -0.90    -0.12%
Indo10Yr.6.6494+0.0333 +0.50%
ICBI…374.1959  -0.4937  -0.13%
US2Yr.4.333  +0.009   +0.21%
US5Yr 3.905  -0.017    -0.43%
US10Yr3.920 -0.021    -0.53%
US30Yr.4.070-0.013    -0.32%
VIX….14.04  +0.84  +6.36%‼️
USDIndx 102.4570 +0.221 +0.22%
Como Indx..265.25  +2.62    +1.00%
BCOMIN……139.93   -1.24     -0.88%
 IndoCDS..69.23    -0.06    -0.09%
  (5-yr INOCD5) (02/01)
IDR…..15481.00 +11.00 +0.07%
Jisdor.15495.00 +22.00 +0.14%
Euro….1.0920  -0.0022  -0.20%
TLKM…25.62  -0.28   -1.08%
(3970)
EIDO….22.05   -0.16   -0.72%
EEM….39.52   -0.22    -0.55%
Oil……..72.70  +2.32  +3.30%‼️
Gold..2042.80 -30.60 -1.48%
Timah..25184.00 -231   -0.91%
(Closed 02/01)
Nickel..16425.00 -140   -0.85%
(Closed 03/01)
Silver……23.16   -0.80     -3.32%
Copper.386.15   -1.90     -0.49%
Iron Ore 62% 136.37   –        -%
 (02/01)
Nturl Gas..2.687  +0.113  +4.39%‼️
Ammonia China.3656.67 +33.34 +0.92%
(Domestic Price)(02/02)
Coal price.128.50  +0.75  +0.59%
(Jan/Newcastle)
Coal price 127.09  +0.15  +0.67%
(Feb/Newcastle)
Coal price.125.75  +0.90  +0.72%
(Mar/Newcastle)
Coal price 124.40  +0.50  +0.40%
(Apr/Newcastle)
Coal price.108.95 +2.80   +2.64%
(Jan/Rotterdam)
Coal price 103.75 +2.20  +2.17%
(Feb/Rotterdam).
Coal price. 99.25  +2.15  +2.21%
(Mar/Rotterdam)
Coal price .97.20  +2.00  +2.10%
(Apr/Rotterdam)
CPO(Mar)..3624   -36        -0.98%
(Source: bursamalaysia.com)
Corn……465.25     +1.50    +0.32%
SoybeanOil 48.60 +0.31    +0.64%
Wheat….600.25    -6.50      -1.07%
Wood pulp..5050.00 +10  +0.20%
(Closed 02/01)
©️Phintraco Sekuritas
Broker Code: AT
Desy Erawati/ DE
Source: Bloomberg, Investing, IBPA, CNBC, Bursa Malaysia

Copyright: Phintraco Sekuritas

Update Global Economic Calendar
3 Jan 2023

GERMANY MARKET :
Unemployment Change (Dec)
Actual : 5K
Forecast : 20K
Previous : 22K

Unemployment Rate (Dec)
Actual : 5.9%
Forecast : 5.9%
Previous : 5.9%

Unemployment Persons (Dec)
Actual : 2.703M
Forecast : –
Previous : 2.702M

U.S MARKET :
MBA Mortgage Applications (Dec/29)
Actual : -10.7%
Forecast : –
Previous : -1.5%

MBA 30-Year Mortgage Rate (Dec/29)
Actual : 6.76%
Forecast : –
Previous : 6.83%

ISM Manufacturing PMI (Dec)
Actual : 47.4
Forecast : 47.1
Previous : 46.7

ISM Manufacturing Employment (Dec)
Actual : 48.1
Forecast : 46.1
Previous : 45.8

ISM Manufacturing New Orders (Dec)
Actual : 47.1
Forecast : –
Previous : 48.3

By PHINTRACO SEKURITAS | Research
– Disclaimer On –

US merah dalem, keliatanya karena release berita ISM manufacturing unemployment dan new order turun. europe merah, asia juga, IHSG kemaren memang sudah diduga jadwal turun, sekarang diharap naik tapi kalo global merah semua rada berat. Semoga hanya sideways atau koreksi kecil

US bond rates ga banyak rubah, USD index naik, metal turun semua, oil gas coal naik, CPO masih turun. Kayanya belum jalan ini ANTM INCO TINS MDKA, tapi harusnya major udah uptrend. AALI LSIP juga

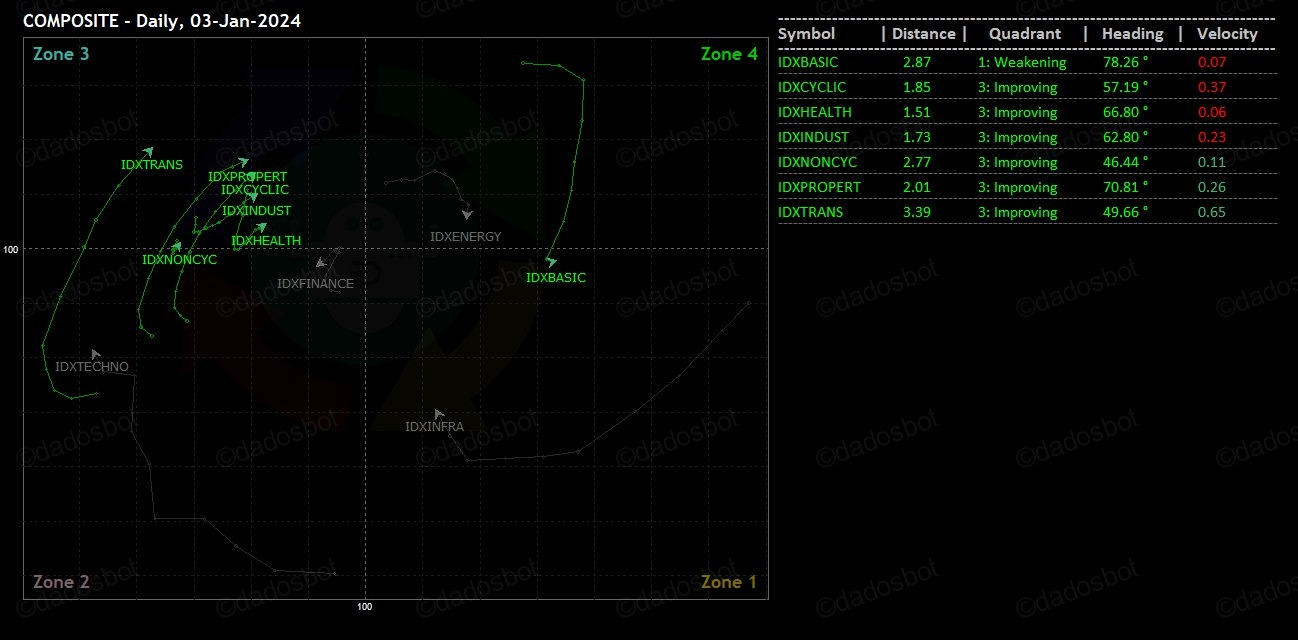
IHSG – stoch up flattening OB, MACD up flattening, MFI sw, w% masih uptrend, BD mulai dist, FNS, udah di wave 5, agak mengkhawatirkan…

Cacing RSI malah all good, Consumer Non-Cyclicals sama Consumer Cyclicals yang arahnya paling bagus

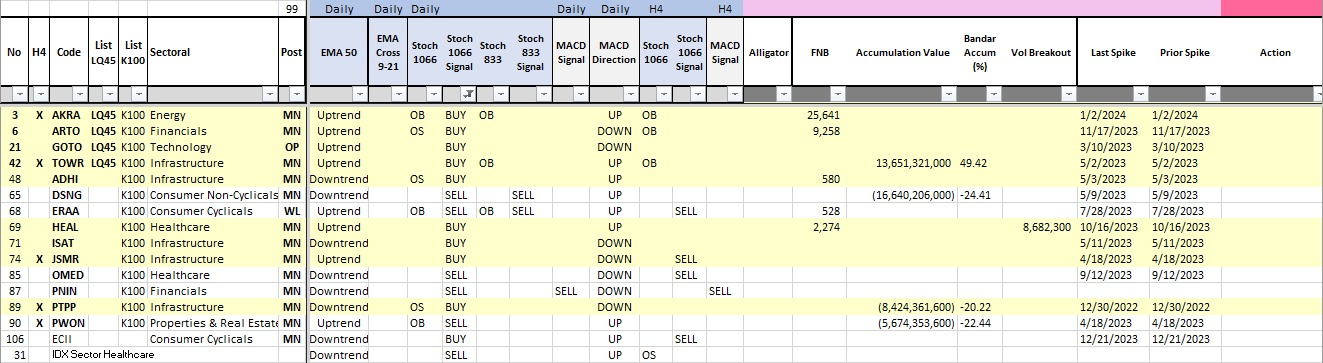
Stochastic Buy Signal: AKRA ARTO GOTO TOWR ADHI HEAL ISAT JSMR PTPP. yang big accum cuma TOWR

MACD Buy Signal: BRIS BBKP BRMS Big accum BRIS BBKP

Stochastic Continuation Signal: INCO big acc MPMX spike

7 Technical Indicators to Build a Trading Toolkit

Written by admin. Posted in Technical Analysis

[ad_1]

Technical indicators are used by traders to gain insight into the supply and demand of securities and market psychology. Together, these indicators form the basis of technical analysis. Metrics, such as trading volume, provide clues as to whether a price move will continue. In this way, indicators can be used to generate buy and sell signals.

Seven of the best indicators for day trading are:

  • On-balance volume (OBV)
  • Accumulation/distribution line
  • Average directional index
  • Aroon oscillator
  • Moving average convergence divergence (MACD)
  • Relative strength index (RSI)
  • Stochastic oscillator

You don’t need to use all of them, rather pick a few that you find helpful in making better trading decisions. Learn more about how these indicators work and how they can help you day trade successfully.

Key Takeaways

  • Technical traders and chartists have a wide variety of indicators, patterns, and oscillators in their toolkit to generate signals.
  • Some of these consider price history, others look at trading volume, and yet others are momentum indicators. Often, these are used in tandem or combination with one another.
  • Here, we look at seven top tools market technicians employ, and that you should become familiar with if you plan to trade based on technical analysis.

Tools of the Trade

The tools of the trade for day traders and technical analysts consist of charting tools that generate signals to buy or sell, or which indicate trends or patterns in the market. Broadly speaking, there are two basic types of technical indicators:

  1. Overlays: Technical indicators that use the same scale as prices are plotted over the top of the prices on a stock chart. Examples include moving averages and Bollinger Bands® or Fibonacci lines.
  2. Oscillators: Rather than being overlaid on a price chart, technical indicators that oscillate between a local minimum and maximum are plotted above or below a price chart. Examples include the stochastic oscillator, MACD, or RSI. It will mainly be these second kind of technical indicators that we consider in this article.

Traders often use several different technical indicators in tandem when analyzing a security. With literally thousands of different options, traders must choose the indicators that work best for them and familiarize themselves with how they work. Traders may also combine technical indicators with more subjective forms of technical analysis, such as looking at chart patterns, to come up with trade ideas. Technical indicators can also be incorporated into automated trading systems given their quantitative nature.

1. On-Balance Volume

First up, use the on-balance volume indicator (OBV) to measure the positive and negative flow of volume in a security over time.

The indicator is a running total of up volume minus down volume. Up volume is how much volume there is on a day when the price rallied. Down volume is the volume on a day when the price falls. Each day volume is added or subtracted from the indicator based on whether the price went higher or lower.

When OBV is rising, it shows that buyers are willing to step in and push the price higher. When OBV is falling, the selling volume is outpacing buying volume, which indicates lower prices. In this way, it acts like a trend confirmation tool. If price and OBV are rising, that helps indicate a continuation of the trend.

Traders who use OBV also watch for divergence. This occurs when the indicator and price are going in different directions. If the price is rising but OBV is falling, that could indicate that the trend is not backed by strong buyers and could soon reverse.

Image by Sabrina Jiang © Investopedia 2020


2. Accumulation/Distribution Line

One of the most commonly used indicators to determine the money flow in and out of a security is the accumulation/distribution line (A/D line).

It is similar to the on-balance volume indicator (OBV), but instead of considering only the closing price of the security for the period, it also takes into account the trading range for the period and where the close is in relation to that range. If a stock finishes near its high, the indicator gives volume more weight than if it closes near the midpoint of its range. The different calculations mean that OBV will work better in some cases and A/D will work better in others.

If the indicator line is trending up, it shows buying interest, since the stock is closing above the halfway point of the range. This helps confirm an uptrend. On the other hand, if A/D is falling, that means the price is finishing in the lower portion of its daily range, and thus volume is considered negative. This helps confirm a downtrend. 

Traders using the A/D line also watch for divergence. If the A/D starts falling while the price is rising, this signals that the trend is in trouble and could reverse. Similarly, if the price is trending lower and A/D starts rising, that could signal higher prices to come.

Image by Sabrina Jiang © Investopedia 2020


3. Average Directional Index

The average directional index (ADX) is a trend indicator used to measure the strength and momentum of a trend. When the ADX is above 40, the trend is considered to have a lot of directional strength, either up or down, depending on the direction the price is moving.

When the ADX indicator is below 20, the trend is considered to be weak or non-trending.

The ADX is the main line on the indicator, usually colored black. There are two additional lines that can be optionally shown. These are DI+ and DI-. These lines are often colored red and green, respectively. All three lines work together to show the direction of the trend as well as the momentum of the trend.

  • ADX above 20 and DI+ above DI-: That’s an uptrend.
  • ADX above 20 and DI- above DI+: That’s a downtrend.
  • ADX below 20 is a weak trend or ranging period, often associated with the DI- and DI+ rapidly crisscrossing each other.

Image by Sabrina Jiang © Investopedia 2020


4. Aroon Indicator

The Aroon oscillator is a technical indicator used to measure whether a security is in a trend, and more specifically if the price is hitting new highs or lows over the calculation period (typically 25).

The indicator can also be used to identify when a new trend is set to begin. The Aroon indicator comprises two lines: an Aroon Up line and an Aroon Down line.

When the Aroon Up crosses above the Aroon Down, that is the first sign of a possible trend change. If the Aroon Up hits 100 and stays relatively close to that level while the Aroon Down stays near zero, that is positive confirmation of an uptrend.

The reverse is also true. If Aroon Down crosses above Aroon Up and stays near 100, this indicates that the downtrend is in force.

Image by Sabrina Jiang © Investopedia 2020


5. MACD

The moving average convergence divergence (MACD) indicator helps traders see the trend direction, as well as the momentum of that trend. It also provides a number of trade signals.

When the MACD is above zero, the price is in an upward phase. If the MACD is below zero, it has entered a bearish period.

The indicator is composed of two lines: the MACD line and a signal line, which moves slower. When MACD crosses below the signal line, it indicates that the price is falling. When the MACD line crosses above the signal line, the price is rising. 

Looking at which side of zero the indicator is on aids in determining which signals to follow. For example, if the indicator is above zero, watch for the MACD to cross above the signal line to buy. If the MACD is below zero, the MACD crossing below the signal line may provide the signal for a possible short trade.

Image by Sabrina Jiang © Investopedia 2020

6. Relative Strength Index

The relative strength index (RSI) has at least three major uses. The indicator moves between zero and 100, plotting recent price gains versus recent price losses. The RSI levels therefore help in gauging momentum and trend strength. 

The most basic use of an RSI is as an overbought and oversold indicator. When RSI moves above 70, the asset is considered overbought and could decline. When the RSI is below 30, the asset is oversold and could rally. However, making this assumption is dangerous; therefore, some traders wait for the indicator to rise above 70 and then drop below before selling, or drop below 30 and then rise back above before buying. 

Divergence is another use of the RSI. When the indicator is moving in a different direction than the price, it shows that the current price trend is weakening and could soon reverse.

A third use for the RSI is support and resistance levels. During uptrends, a stock will often hold above the 30 level and frequently reach 70 or above. When a stock is in a downtrend, the RSI will typically hold below 70 and frequently reach 30 or below.

Image by Sabrina Jiang © Investopedia 2020


7. Stochastic Oscillator

The stochastic oscillator is an indicator that measures the current price relative to the price range over a number of periods. Plotted between zero and 100, the idea is that, when the trend is up, the price should be making new highs. In a downtrend, the price tends to make new lows. The stochastic tracks whether this is happening.

The stochastic moves up and down relatively quickly as it is rare for the price to make continual highs, keeping the stochastic near 100, or continual lows, keeping the stochastic near zero. Therefore, the stochastic is often used as an overbought and oversold indicator. Values above 80 are considered overbought, while levels below 20 are considered oversold.

Consider the overall price trend when using overbought and oversold levels. For example, during an uptrend, when the indicator drops below 20 and rises back above it, that is a possible buy signal. But rallies above 80 are less consequential because we expect to see the indicator to move to 80 and above regularly during an uptrend. During a downtrend, look for the indicator to move above 80 and then drop back below to signal a possible short trade. The 20 level is less significant in a downtrend.

Image by Sabrina Jiang © Investopedia 2020


Is Technical Analysis Reliable?

Technical analysis is the reading of market sentiment via the use of graph patterns and signals. Various empirical studies have pointed to its effectiveness, but the range of success is varied and its accuracy remains undecided. It is best to use a suite of technical tools and indicators in tandem with other techniques like fundamental analysis to improve reliability.

Which Technical Indicator Can Best Spot Overbought/Oversold Conditions?

The relative strength index (RSI) is among the most popular technical indicators for identifying overbought or oversold stocks. The RSI is bound between 0 and 100. Traditionally, a reading above 70 indicates overbought ad below 30 oversold.

How Many Technical Analysis Tools Are There?

There are several dozen technical analysis tools, including a range of indicators and chart patterns. Market technicians are always creating new tools and refining old ones.

The Bottom Line

The goal of every short-term trader is to determine the direction of a given asset’s momentum and to attempt to profit from it. There have been hundreds of technical indicators and oscillators developed for this specific purpose, and this article has provided a handful that you can start trying out. Use the indicators to develop new strategies or consider incorporating them into your current strategies. To determine which ones to use, try them out in a demo account. Pick the ones you like the most, and leave the rest.

[ad_2]

Source link

Aroon Oscillator: Definition, Calculation Formula, Trade Signals

Written by admin. Posted in A, Financial Terms Dictionary

Aroon Oscillator: Definition, Calculation Formula, Trade Signals

[ad_1]

What Is the Aroon Oscillator?

The Aroon Oscillator is a trend-following indicator that uses aspects of the Aroon Indicator (Aroon Up and Aroon Down) to gauge the strength of a current trend and the likelihood that it will continue.

Key Takeaways

  • The Aroon Oscillator uses Aroon Up and Aroon Down to create the oscillator.
  • Aroon Up and Aroon Down measure the number of periods since the last 25-period high and low.
  • The Aroon Oscillator crosses above the zero line when Aroon Up moves above Aroon Down. The oscillator drops below the zero line when the Aroon Down moves below the Aroon Up.
TradingView.

Understanding the Aroon Oscillator

Aroon oscillator readings above zero indicate that an uptrend is present, while readings below zero indicate that a downtrend is present. Traders watch for zero line crossovers to signal potential trend changes. They also watch for big moves, above 50 or below -50 to signal strong price moves.

The Aroon Oscillator was developed by Tushar Chande in 1995 as part of the Aroon Indicator system. Chande’s intention for the system was to highlight short-term trend changes. The name Aroon is derived from the Sanskrit language and roughly translates to “dawn’s early light.”

The Aroon Indicator system includes Aroon Up, Aroon Down, and Aroon Oscillator. The Aroon Up and Aroon Down lines must be calculated first before drawing the Aroon Oscillator. This indicator typically uses a timeframe of 25 periods, however, the timeframe is subjective. Using more periods garners fewer waves and a smoother-looking indicator. Using fewer periods generates more waves and a quicker turnaround in the indicator. The oscillator moves between -100 and 100. A high oscillator value is an indication of an uptrend while a low oscillator value is an indication of a downtrend.

Aroon Up and Aroon Down move between zero and 100. On a scale of zero to 100, the higher the indicator’s value, the stronger the trend. For example, a price reaching new highs one day ago would have an Aroon Up value of 96 ((25-1)/25)x100). Similarly, a price reaching new lows one day ago would have an Aroon Down value of 96 ((25-1)x100).

The highs and lows used in the Aroon Up and Aroon Down calculations help to create an inverse relationship between the two indicators. When the Aroon Up value increases, the Aroon Down value will typically see a decrease and vice versa.

When Aroon Up remains high from consecutive new highs, the oscillator value will be high, following the uptrend. When a security’s price is on a downtrend with many new lows, the Aroon Down value will be higher resulting in a lower oscillator value.

The Aroon Oscillator line can be included with or without the Aroon Up and Aroon Down when viewing a chart. Significant changes in the direction of the Aroon Oscillator can help to identify a new trend.

Aroon Oscillator Formula and Calculation

The formula for the Aroon oscillator is:


Aroon Oscillator = Aroon Up Aroon Down Aroon Up = 100 ( 25 Periods Since 25-Period High ) 25 Aroon Down = 100 ( 25 Periods Since 25-Period Low ) 25 \begin{aligned} &\text{Aroon Oscillator}=\text{Aroon Up}-\text{Aroon Down}\\ &\text{Aroon Up}=100*\frac{\left(25 – \text{Periods Since 25-Period High}\right)}{25}\\ &\text{Aroon Down}=100*\frac{\left(25 – \text{Periods Since 25-Period Low}\right)}{25}\\ \end{aligned}
Aroon Oscillator=Aroon UpAroon DownAroon Up=10025(25Periods Since 25-Period High)Aroon Down=10025(25Periods Since 25-Period Low)

To calculate the Aroon oscillator:

  1. Calculate Aroon Up by finding how many periods it has been since the last 25-period high. Subtract this from 25, then divide the result by 25. Multiply by 100.
  2. Calculate Aroon Down by finding how many periods it has been since the last 25-period low. Subtract this from 25, then divide the result by 25. Multiply by 100.
  3. Subtract Aroon Down from Aroon Up to get the Aroon Oscillator value.
  4. Repeat the steps as each time period ends.

Aroon oscillator differs from the rate of change (ROC) indicator in that the former is tracking whether a 25-period high or low occurred more recently while the latter tracks the momentum by looking at highs and lows and how far the current price has moved relative to a price in the past.

Aroon Oscillator Trade Signals

The Aroon Oscillator can generate trade signals or provide insight into the current trend direction of an asset.

When the oscillator moves above the zero line, the Aroon Up is crossing above the Aroon Down and the price has made a high more recently than a low, a sign that an uptrend is beginning.

When the oscillator moves below zero, the Aroon Down is crossing below the Aroon Up. A low occurred more recently than a high, which could signal that a downtrend is starting.

Limitations of Using the Aroon Oscillator

The Aroon Oscillator keeps a trader in a trade when a long-term trend develops. During an uptrend, for example, the price tends to keep achieving new highs which keep the oscillator above zero.

During choppy market conditions, the indicator will provide poor trade signals, as the price and the oscillator whipsaw back and forth.

The indicator may provide trade signals too late to be useful. The price may have already run a significant course before a trade signal develops. The price may be due for a retracement when the trade signal is appearing.

The number of periods is also arbitrary and there is no validity that a more recent high or low within the last 25-periods will guarantee a new and sustained uptrend or downtrend.

The indicator is best used in conjunction with price action analysis fundamentals of long-term trading, and other technical indicators.

Investopedia does not provide tax, investment, or financial services and advice. The information is presented without consideration of the investment objectives, risk tolerance, or financial circumstances of any specific investor and might not be suitable for all investors. Investing involves risk, including the possible loss of principal.

[ad_2]

Source link