Posts Tagged ‘design’

Daily Analysis 20240902

Written by itho suryoputro. Posted in Daily Analysis, Web Design

September 02nd, 2024

Stocks close higher Friday, S&P 500 posts fourth straight winning month

Stocks rose on Friday, with the Dow Jones Industrial Average
posting a fresh record high as investors ended a volatile month on a high note. Traders also mulled over crucial inflation data watched closely by the Federal Reserve.

Dow…….41563 +228.03 +0.55%
Nasdaq. .17714 +197.2 +1.13%
S&P 500 5648 +56.4 +1.01%

FTSE…8377.0 -3.01 -0.04%
Dax……18907 -5.7 -0.03%
CAC……7631 -10.0 -0.13%

Nikkei….38648 +285.2 +0.74%
HSI……..17789 +202.8 +1.14%
Shanghai.2842 +19.1 +0.68%

IDX….7670.73 +43.13 +0.57%
LQ45…944.48 +2.36 +0.25%
IDX30.478.92 +2.14 +0.45%

IDXEnergy. 2622.89 -14.54 -0.54%
IDX BscMat1357.05 +4.40 +0.33%
IDX Indstrl..1079.47 -4.80 -0.44%
IDXNONCYC.711.39 +0.76 +0.11%
IDX Hlthcare1464.16 +2.51 +0.17%
IDXCYCLIC….914.24 +4.36 +0.48%
IDXTechno 3263.30 +21.44 +0.66%
IDX Transp 1448.28 +13.79 +0.96%
IDX Infrast 1629.18 +19.57 +1.22%
IDX Finance1473.49 -1.79 -0.12%
IDX Banking1322.59 +6.71 +0.99%
IDX Property….721 -2.70 -0.38%

Indo10Yr.6.6834 -0.0165 -0.25%
ICBI….391.1384 -0.0792 -0.02%
US2Yr.3.919 +0.021 +0.54%
US5Yr 3.708 +0.040 +1.09%
US10Yr3.909 +0.041 +1.06%
US30Yr.4.201+0.051 +1.23%
VIX..15.00 -0.65 -4.15%

USDIndx 101.6980❗️ +0.355 +0.35%
Como Indx….277.03 -2.85 -1.02%
BCOMIN………144.59 -0.41 -0.29%

IndoCDS..67.28 +0.01 +0.01%
(5-yr INOCD5) (29/08)

IDR…….15455.00 +31.50 +0.20%
Jisdor..15473.00 +64.00 +0.41%

Euro…1.1048❗️ -0.0032 -0.29%

TLKM…19.60 +0.14 +0.72 %
( 3033)
EIDO…..21.77 -0.08 -0.37%
EEM….43.37 +0.09 +0.21%

Oil………..73.55 -2.34 -3.08%‼️
(WTI,Nymex)
Oil………..76.93 -3.01 -3.77%‼️
(Brent)
Gold…2527.60 -26.30 -1.03%
(Comex)
Gold…2503.39 -16.99 -0.67%
(Spot/XAUUSD)
Timah..32346.00 +1.00 +0%
(Closed 30/08)
Nickel..16747.50 -274.50 -1.61%
(Closed 30/08)
Silver…29.14 -0.69 -2.31%
Copper.421.15 +0.25 +0.06%

Iron Ore 62% 98.70 +0.07 +0.07%
(28/08)
Nturl Gas 2.146 +0.003 +0.14%
Ammonia China 2583.33 -60.00 -2.27%
(Domestic Price)(29/08)

Coal price.143.75 +0.50 +0.35%
(Sept/Newcastle)
Coal price.145.25 +0.70 +0.48%
(Oct/Newcastle)
Coal price.146.80 unch +0%
(Nov/Newcastle)
Coal price..148.35 -0.75 -0.50%
(Dec/Newcastle)

Coal price.120.50 +1.20 +1.01%
(Sept/Rotterdam)
Coal price.121.65 +1.25 +1.04%
(Oct/Rotterdam)
Coal price 122.85 +0.75 +0.61%
(Nov/Rotterdam)
Coal price.124.10 +1.10 +0.89%
(Dec/Rotterdam)

CPO(Nov)..3978 +36 +0.91%
(Source: bursamalaysia.com)

Corn………401.00 +5.00 +1.26%
SoybeanOil 42.01 -0.12 -0.28%
Wheat……551.50 +2.75 +0.50%

Wood pulp.4900.00 unch +0%
(Closed 01/09)

©️Phintraco Sekuritas
Broker Code: AT
Desy Erawati/ DE
Source: Bloomberg, Investing, IBPA, CNBC, Bursa Malaysia
Copyright: Phintraco Sekuritas

US closing ijo jum’at, europe merah, asia ijo, tapi US bond yield merah, ada kemungkinan hari ini merah juga IHSG, tapi semoga ikut DJI yang cetakk new record high.

USD index up, metal2 kebanyakan down, oil down gas up coal up, CPO up, masih berharap AALI LSIP SIMP lanjut jalan

IHSG – stoch sw, macd up, MFI w% sw, BD acc FNB dan membesar, reg bear belum confirmed semoga cancelled, keliatan dijagain dari volume yang rata dan bandar accum. Sepertinya ngejar target technical wave 3 di 1.618 fibo extension

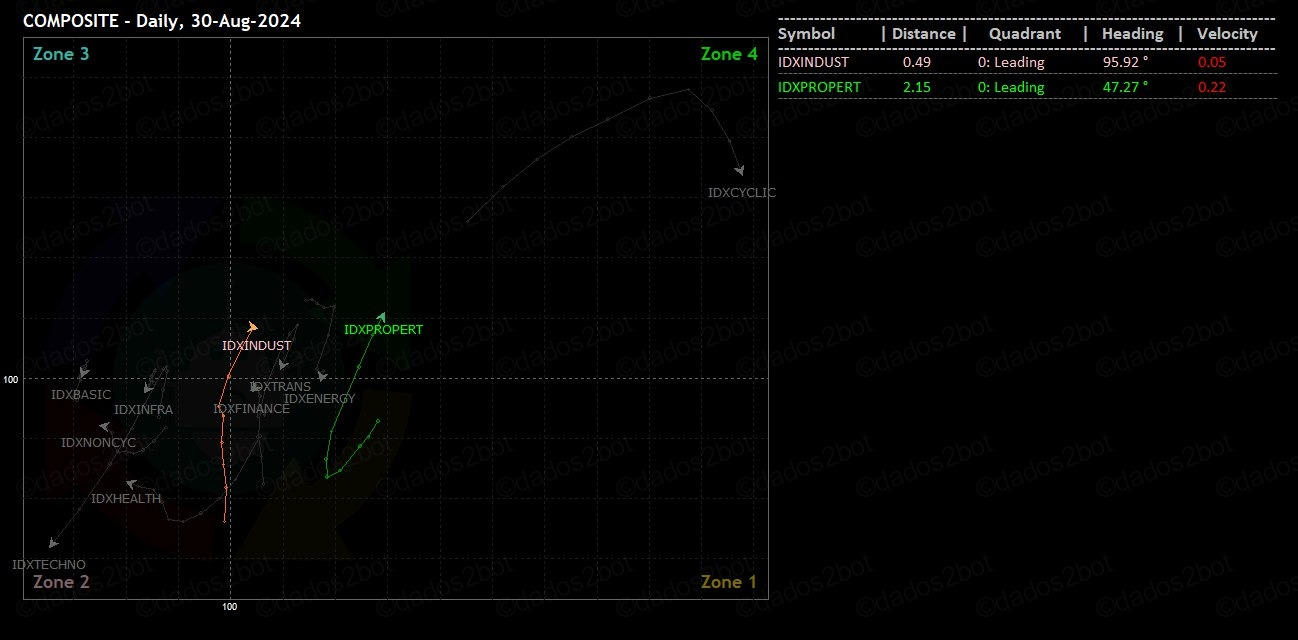
Industrials, Property


Stochastic Buy Signal: BBTN MBMA TLKM BRMS CTRA DSNG MYOR PANI SSIA TPIA, big accum BBTN TPIA

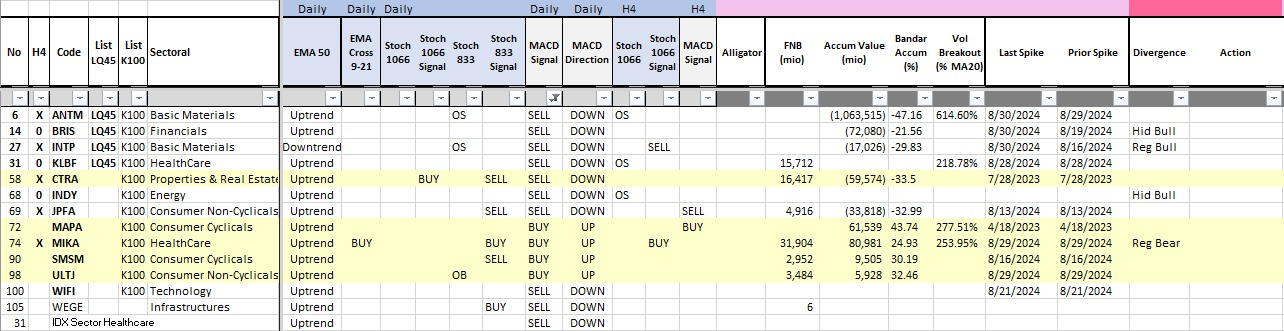
MACD Buy Signal: MAPA MIKA SMSM ULTJ, semua big accum dan ada spike di Agustus

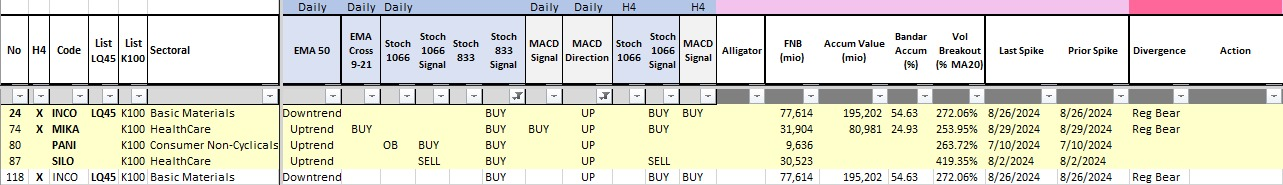
Stochastic Continuation Signal and Big Accum: INCO MIKA PANI SILO

TLKM – supertrend buy signal, Stoch buy, MACD up, MFI up, w% uptrend, BD acc, FNS tipis, ada gap di atas, diluar kekhawatiran index mau start wave 4, harusnya firm jalan ini TLKM

Jum’at ada freq spike, kalo bener ini TLKM jalan index beresin wave 3 ke atas 8000

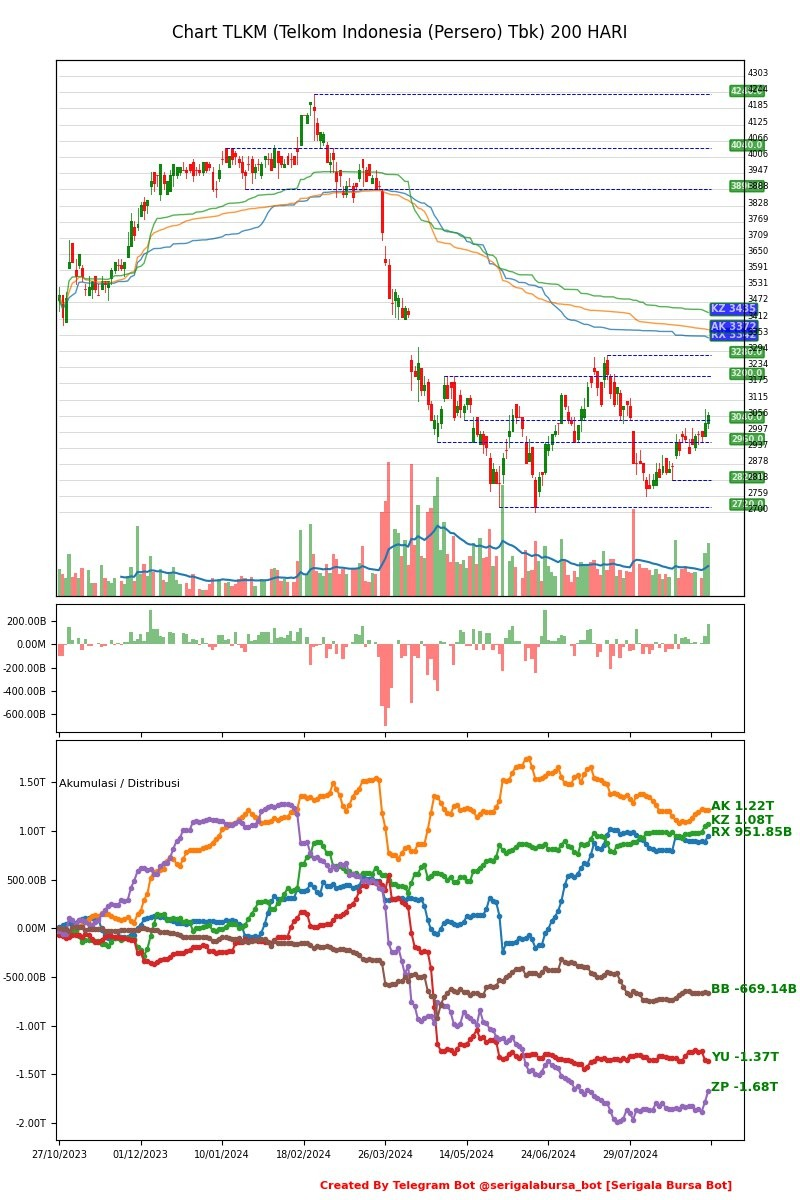
Average aman, 3 biggest holder accum malu malu, saya masih hold, yang belum punya bisa entry juga, tapi begitu signal ngebalik langsung buang, karena ada resiko IHSG wave 4

BBTN – stoch rev buy, MACD still up, MFI down, w% masih uptrend, BD FF acc, ada freq spike jg, kalo liat retracement pattern harusnya jalan ke fibo 61, CNH juga harusnya nganter ke 1650

Spike target done

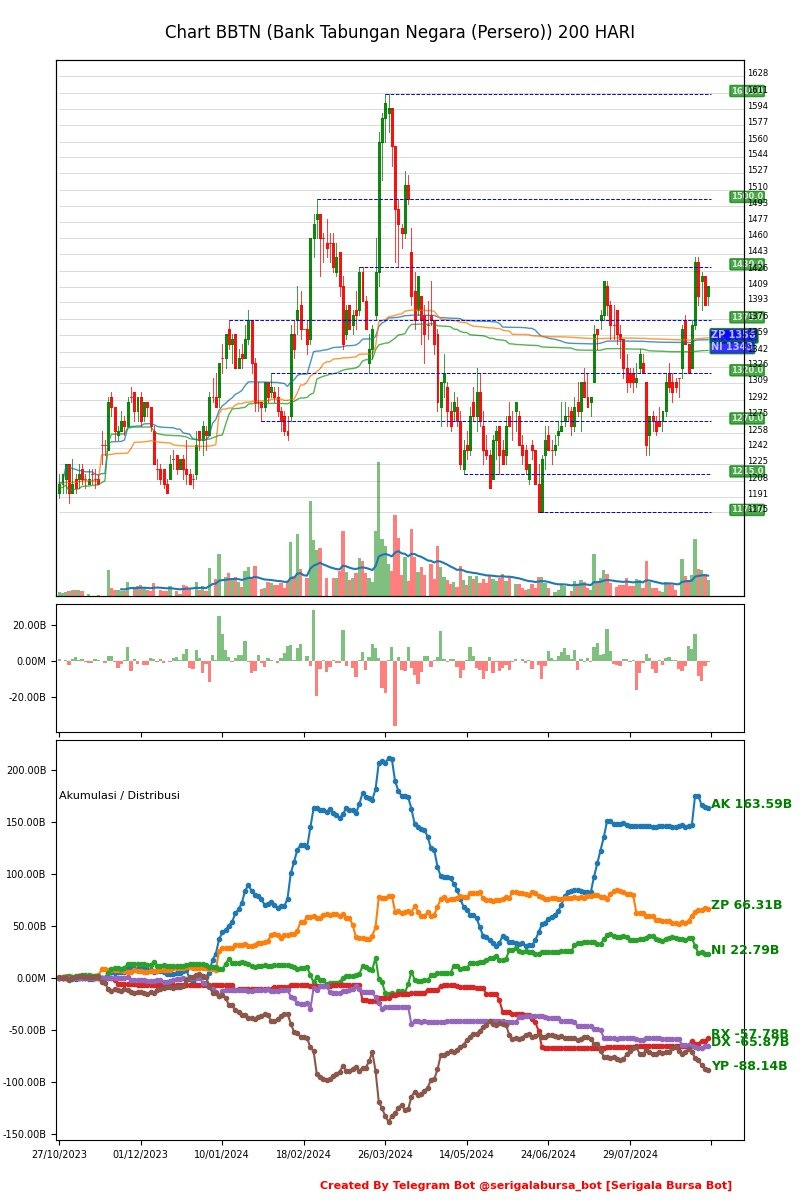
Average Bandar udah dibawah running price, jadi agak khawatir belanja. Emang ga akan beli juga sih, tapi technically ok, cuma harus pantau ketat kalo ngebalik

MAPA PBV 4, MIKA PBV 7, skip…

ULTJ – stoch up, macd buy, BD FF acc, ada freq spike, MFI up w% uptrend, reg bull div confirmed, harusnya jalan ya

Spike beberapa kali, terakhir terlihat spike jual, ada lagi baru ga terlalu tinggi tapi firm sih

average nya dibawah running price, technical sih ok, kalo mau entry mending BOW di averagenya AK, kalo daper BOW 1800

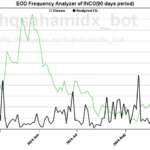
INCO – stocj rev up, MACD up, 833 buy, big acc BD and FF, ada spike juga, reg bull div confirmed, udah bikin higher low, harusnya jalan ini

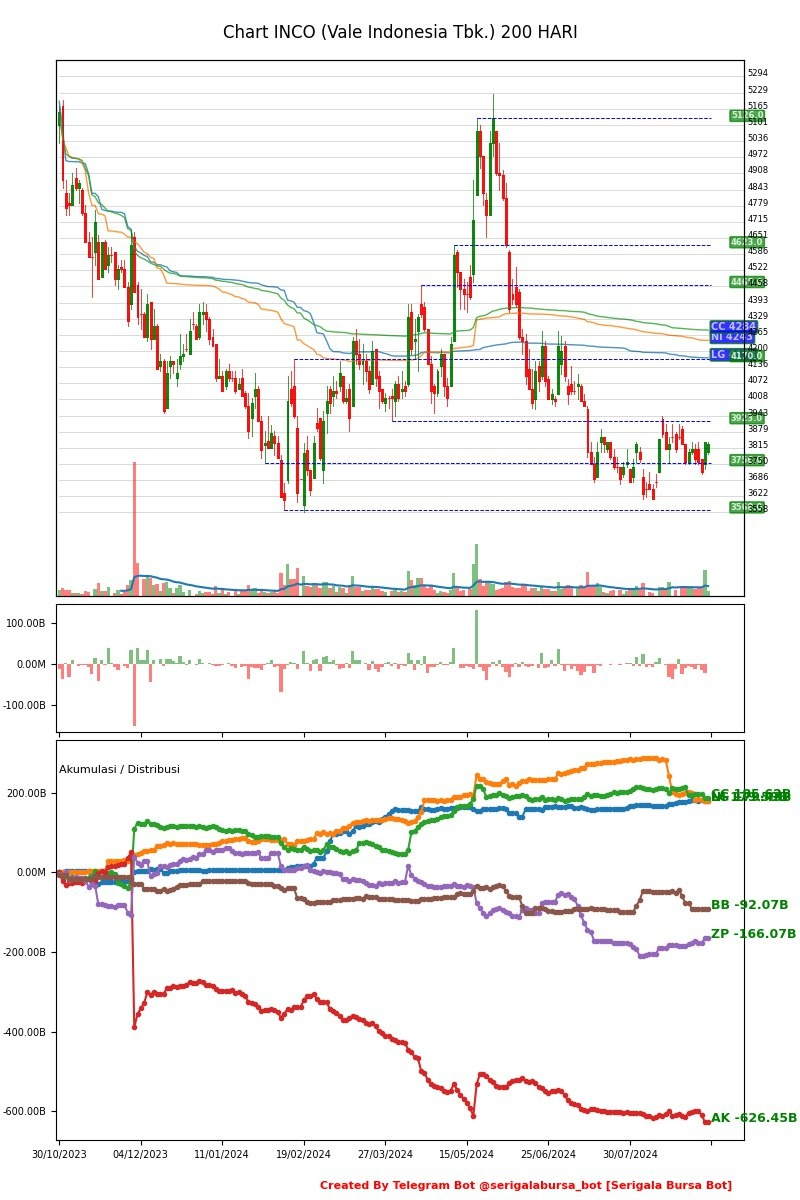
Wah, average aman, tapi belum keliatan accum lagi disini, beda sama data stockbit

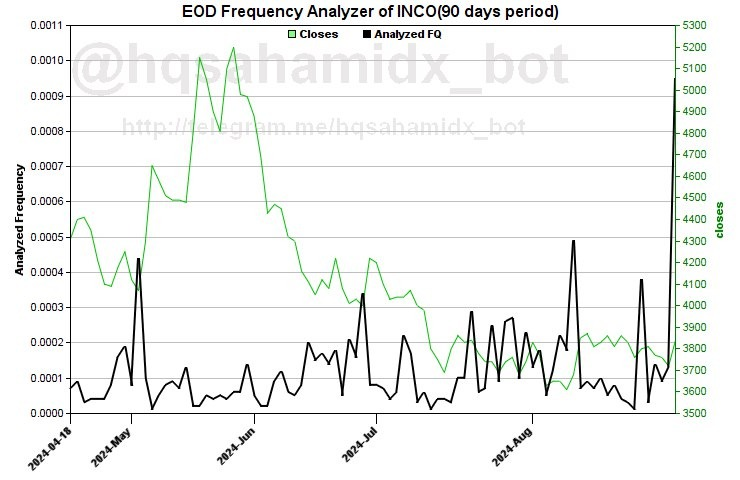
Wah, tadinya mau jual buat kenakalan, ga jadi ini mah, HOLD INCO, mau hajatan iniiiiiii

Yang jelas secara technical ok, BUY INCO mumpung merah


Metrics Definition

Written by admin. Posted in Technical Analysis

[ad_1]

What Are Metrics?

Metrics are measures of quantitative assessment commonly used for assessing, comparing, and tracking performance or production. Generally, a group of metrics will typically be used to build a dashboard that management or analysts review on a regular basis to maintain performance assessments, opinions, and business strategies. 

Understanding Metrics

Metrics have been used in accounting, operations, and performance analysis throughout history.

Metrics come in a wide range of varieties with industry standards and proprietary models often governing their use.

Executives use them to analyze corporate finance and operational strategies. Analysts use them to form opinions and investment recommendations. Portfolio managers use metrics to guide their investing portfolios. Furthermore, project managers also find them essential in leading and managing strategic projects of all kinds.

Overall, metrics refer to a wide variety of data points generated from a multitude of methods. Best practices across industries have created a common set of comprehensive metrics used in ongoing evaluations. However, individual cases and scenarios typically guide the choice of metrics used.

Choosing Metrics

Every business executive, analyst, portfolio manager, and the project manager has a range of data sources available to them for building and structuring their own metric analysis. This can potentially make it difficult to choose the best metrics needed for important assessments and evaluations. Generally, managers seek to build a dashboard of what has come to be known as key performance indicators (KPIs).

In order to establish a useful metric, a manager must first assess its goals. From there, it is important to find the best outputs that measure the activities related to these goals. A final step is also setting goals and targets for KPI metrics that are integrated with business decisions.

Academics and corporate researchers have defined many industry metrics and methods that can help shape the building of KPIs and other metric dashboards. An entire decision analysis method called applied information economics was developed by Douglas Hubbard for analyzing metrics in a variety of business applications. Other popular decision analysis methods include cost-benefit analysis, forecasting, and Monte Carlo simulation.

Several businesses have also popularized certain methods that have become industry standards in many sectors. DuPont began using metrics to better their own business and in the process came up with the popular DuPont analysis which closely isolates variables involved in the return on equity (ROE) metric. GE has also commissioned a set of metrics known as Six Sigma that are commonly used today, with metrics tracked in six key areas: critical to quality; defects; process capability; variation; stable operations; and, design for Six Sigma.

Examples of Metrics

While there are a wide range of metrics, below are some commonly used tools:

Economic Metrics

Operational Company Metrics

From a comprehensive perspective, executives, industry analysts, and individual investors often look at key operational performance measures of a company, all from different perspectives. Some top-level operational metrics include measures derived from the analysis of a company’s financial statements. Key financial statement metrics include sales, earnings before interest and tax (EBIT), net income, earnings per share, margins, efficiency ratios, liquidity ratios, leverage ratios, and rates of return. Each of these metrics provides a different insight into the operational efficiency of a company.

Executives use these operational metrics to make corporate decisions involving costs, labor, financing, and investing. Executives and analysts also build complex financial models to identify future growth and value prospects, integrating both economic and operational metric forecasts.

There are several metrics that are key to comparing the financial position of companies against their competitors or the market overall. Two of these key comparable metrics, which are based on market value, include price-to-earnings ratio and price-to-book ratio.

Portfolio Management

Portfolio managers use metrics to identify investing allocations in a portfolio. All types of metrics are also used for analyzing and investing in securities that fit a specific portfolio strategy. For example, environmental, social and governance (ESG) criteria are a set of standards for a company’s operations that socially conscious investors use to screen potential investments.

Project Management Metrics

In project management, metrics are essential in measuring project progression, output targets, and overall project success. Some of the areas where metric analysis is often needed include resources, cost, time, scope, quality, safety, and actions. Project managers have the responsibility to choose metrics that provide the best analysis and directional insight for a project. Metrics are followed in order to measure the overall progression, production, and performance.

Key Takeaways

  • Metrics are measures of quantitative assessment commonly used for comparing, and tracking performance or production.
  • Metrics can be used in a variety of scenarios.
  • Metrics are heavily relied on in the financial analysis of companies by both internal managers and external stakeholders.

[ad_2]

Source link

Navigating the Cosmos to Uncover the Mysteries of the Universe

Written by itho suryoputro. Posted in Science

WhatsApp Image 2022-06-27 at 8.47.10 AM

As we delve into this realm of innovation, the narrative unfolds with a focus on cutting-edge developments that are set to reshape our world. From artificial intelligence and machine learning to breakthroughs in renewable energy and sustainable technologies.

In the fast-evolving landscape of technological advancements, the future holds exciting promises as we stand on the frontlines of change. The title “Tech-Powered Future Updates” encapsulates the dynamic synergy between technology and progress.

Good design is making something intelligible and memorable. Great design is making something memorable and meaningful.

Dieter Rams

Online multiplayer shooters, like CS:GO, Fortnite, and PUBG, are currently dominating the gaming world, thanks to professional gamers, esports tournaments, Twitch streamers, and YouTube gaming channels. Others have spawned sequels that out play and out perform their original games. Some games that have been released years ago are still popular today.

The Impact of Tech-Powered Future Updates

Not all websites are made equal. Some websites are simple, logical, and easy to use. Others are a messy hodgepodge of pages and links.

Without website navigation, your visitors can’t figure out how to find your blog, your email signup page, your product listings, pricing, contact information, or help docs.

Quick and easy access to the content they’re after is more important for your website users than a… visually-stunning design.

Website navigation allows visitors to flow from one page to another without frustration. If you’ve done your job well, visitors leave your site with the intention to return and might even buy something from you or sign up for your email list.

Bad navigation is an especially common problem. We’ve all struggled to find things on disorganized websites without any logical structure. It feels hopeless.

  • VR offers immersive and realistic virtual environments.
  • Explore different locations and landmarks without leaving your space.
  • Visualize and interact with 3D models for design and architecture.
  • Interactive and immersive gaming experiences.
  • Creates memorable and immersive marketing experiences.
  • Virtual offices and collaborative environments for remote teams.

As we navigate this tech-powered frontier, the updates the frontlines promise a fascinating journey into the unknown, where the convergence of innovation and societal needs becomes the epicenter of our collective progress.

Price Comparison

u0022Price Comparisonu0022 is a concise title suggesting a third installment in the Meta Quest series focused on comparing prices.

Meta Quest 3
$499$399See It
Meta Quest 2
$299$249See It
Meta Quest Pro
$999$899See It

Using “complex large pictures”. Because a carousel generally carries a lot of picture messages, complex large pictures result in low performance and “slow loading rate” of the sites, especially those whose first homepages are occupied by high-resolution carousels.

Tech-Infused Upgrades Shaping the Future

In design, rhythm is created by simply repeating elements in predictable patterns. This repetition is a natural thing that occurs everywhere in our world. As people, we are driven everyday by predictable, timed events.

One of the best ways to use repetition and rhythm in web design is in the site’s navigation menu. A consistent, easy-to-follow pattern—in color, layout, etc. Gives users an intuitive roadmap to everything you want to share on your site.

Everything we recommend

From artificial intelligence and machine learning to breakthroughs in renewable energy and sustainable technologies, these updates herald a transformative era where technology becomes the driving force behind positive change.

Rhythm also factors into the layout of content. For example, you “might have” blog articles, press releases, and events each follow their own certain layout pattern.

Compare VR products

Meta Quest 3PSVR 2Meta Quest Pro
Max Reoslution (Per Eye)2064 x 22082000 x 20401800×1920
Field of View110°110°106°
Refresh Rate120Hz120Hz90Hz
Screen TypeDual Screen LCDHDR OLEDDual Screen LCD
OpticsPancakeFresnelPancake
Digital CrownDigital Crown with haptic feedbackDigital Crown with haptic feedbackDigital Crown with haptic feedback
AltimeterAlways-on AltimeterAlways-on AltimeterAlways-on Altimeter
SpeakerBuilt-in speakerBuilt-in speakerDual speakers
Gyroscope
Accelerometer
Noise Monitoring
Requirements
Electrical heart sensor (ECG app)
Weight515g5605g722g

Exploring the Frontlines of Tech-Powered Future Updates

Nobody enjoys looking at an ugly web page. Garish colors, cluttered and distracting animation can all turn customers “off” and send them shopping “somewhere else”. Basic composition rules to create more effective:

  • Low-power mode for extended battery life
  • Strong performance
  • Slick design
  • Sub-par 18-hour battery life

UX design refers to the term “user experience design”, while UI stands for “user interface design. Both elements are crucial to a product and work closely together. But despite their relationship, the roles themselves are quite different.

The Next Wave of Transformation Through Technology

Good design guides the user by communicating purpose and priority. For that reason, every part of the design should be based on an informed decision” rather than an arbitrary result of personal taste or the current trend.

Provide distinct styles for interactive elements, such as links and buttons, to make them easy to identify. For example, “change the appearance of links” on mouse hover, “keyboard focus”, and “touch-screen activation”.

Tech-Powered Updates Leading the Way

As we navigate this tech-powered frontier, the updates on the frontlines promise a fascinating journey into the unknown, where the convergence of innovation and societal needs becomes the epicenter of our collective progress.

Design is not the end-all solution to all of the worlds problems — but with the right thinking and application, it can definitely be a good beginning to start tackling them.

AI Unleashed Exploring the Future of Machine Learning and Robotics

Written by itho suryoputro. Posted in Science

As we delve into this realm of innovation, the narrative unfolds with a focus on cutting-edge developments that are set to reshape our world. From artificial intelligence and machine learning to breakthroughs in renewable energy and sustainable technologies.

In the fast-evolving landscape of technological advancements, the future holds exciting promises as we stand on the frontlines of change. The title “Tech-Powered Future Updates” encapsulates the dynamic synergy between technology and progress.

Good design is making something intelligible and memorable. Great design is making something memorable and meaningful.

Dieter Rams

Online multiplayer shooters, like CS:GO, Fortnite, and PUBG, are currently dominating the gaming world, thanks to professional gamers, esports tournaments, Twitch streamers, and YouTube gaming channels. Others have spawned sequels that out play and out perform their original games. Some games that have been released years ago are still popular today.

The Impact of Tech-Powered Future Updates

Not all websites are made equal. Some websites are simple, logical, and easy to use. Others are a messy hodgepodge of pages and links.

Without website navigation, your visitors can’t figure out how to find your blog, your email signup page, your product listings, pricing, contact information, or help docs.

Quick and easy access to the content they’re after is more important for your website users than a… visually-stunning design.

Website navigation allows visitors to flow from one page to another without frustration. If you’ve done your job well, visitors leave your site with the intention to return and might even buy something from you or sign up for your email list.

Bad navigation is an especially common problem. We’ve all struggled to find things on disorganized websites without any logical structure. It feels hopeless.

  • VR offers immersive and realistic virtual environments.
  • Explore different locations and landmarks without leaving your space.
  • Visualize and interact with 3D models for design and architecture.
  • Interactive and immersive gaming experiences.
  • Creates memorable and immersive marketing experiences.
  • Virtual offices and collaborative environments for remote teams.

As we navigate this tech-powered frontier, the updates the frontlines promise a fascinating journey into the unknown, where the convergence of innovation and societal needs becomes the epicenter of our collective progress.

Price Comparison

u0022Price Comparisonu0022 is a concise title suggesting a third installment in the Meta Quest series focused on comparing prices.

Meta Quest 3
$499$399See It
Meta Quest 2
$299$249See It
Meta Quest Pro
$999$899See It

Using “complex large pictures”. Because a carousel generally carries a lot of picture messages, complex large pictures result in low performance and “slow loading rate” of the sites, especially those whose first homepages are occupied by high-resolution carousels.

Tech-Infused Upgrades Shaping the Future

In design, rhythm is created by simply repeating elements in predictable patterns. This repetition is a natural thing that occurs everywhere in our world. As people, we are driven everyday by predictable, timed events.

One of the best ways to use repetition and rhythm in web design is in the site’s navigation menu. A consistent, easy-to-follow pattern—in color, layout, etc. Gives users an intuitive roadmap to everything you want to share on your site.

Everything we recommend

From artificial intelligence and machine learning to breakthroughs in renewable energy and sustainable technologies, these updates herald a transformative era where technology becomes the driving force behind positive change.

Rhythm also factors into the layout of content. For example, you “might have” blog articles, press releases, and events each follow their own certain layout pattern.

Compare VR products

Meta Quest 3PSVR 2Meta Quest Pro
Max Reoslution (Per Eye)2064 x 22082000 x 20401800×1920
Field of View110°110°106°
Refresh Rate120Hz120Hz90Hz
Screen TypeDual Screen LCDHDR OLEDDual Screen LCD
OpticsPancakeFresnelPancake
Digital CrownDigital Crown with haptic feedbackDigital Crown with haptic feedbackDigital Crown with haptic feedback
AltimeterAlways-on AltimeterAlways-on AltimeterAlways-on Altimeter
SpeakerBuilt-in speakerBuilt-in speakerDual speakers
Gyroscope
Accelerometer
Noise Monitoring
Requirements
Electrical heart sensor (ECG app)
Weight515g5605g722g

Exploring the Frontlines of Tech-Powered Future Updates

Nobody enjoys looking at an ugly web page. Garish colors, cluttered and distracting animation can all turn customers “off” and send them shopping “somewhere else”. Basic composition rules to create more effective:

  • Low-power mode for extended battery life
  • Strong performance
  • Slick design
  • Sub-par 18-hour battery life

UX design refers to the term “user experience design”, while UI stands for “user interface design. Both elements are crucial to a product and work closely together. But despite their relationship, the roles themselves are quite different.

The Next Wave of Transformation Through Technology

Good design guides the user by communicating purpose and priority. For that reason, every part of the design should be based on an informed decision” rather than an arbitrary result of personal taste or the current trend.

Provide distinct styles for interactive elements, such as links and buttons, to make them easy to identify. For example, “change the appearance of links” on mouse hover, “keyboard focus”, and “touch-screen activation”.

Tech-Powered Updates Leading the Way

As we navigate this tech-powered frontier, the updates on the frontlines promise a fascinating journey into the unknown, where the convergence of innovation and societal needs becomes the epicenter of our collective progress.

Design is not the end-all solution to all of the worlds problems — but with the right thinking and application, it can definitely be a good beginning to start tackling them.

Error: Only up to 6 modules are supported in this layout. If you need more add your own layout.